Stepwise Analytics
Overview
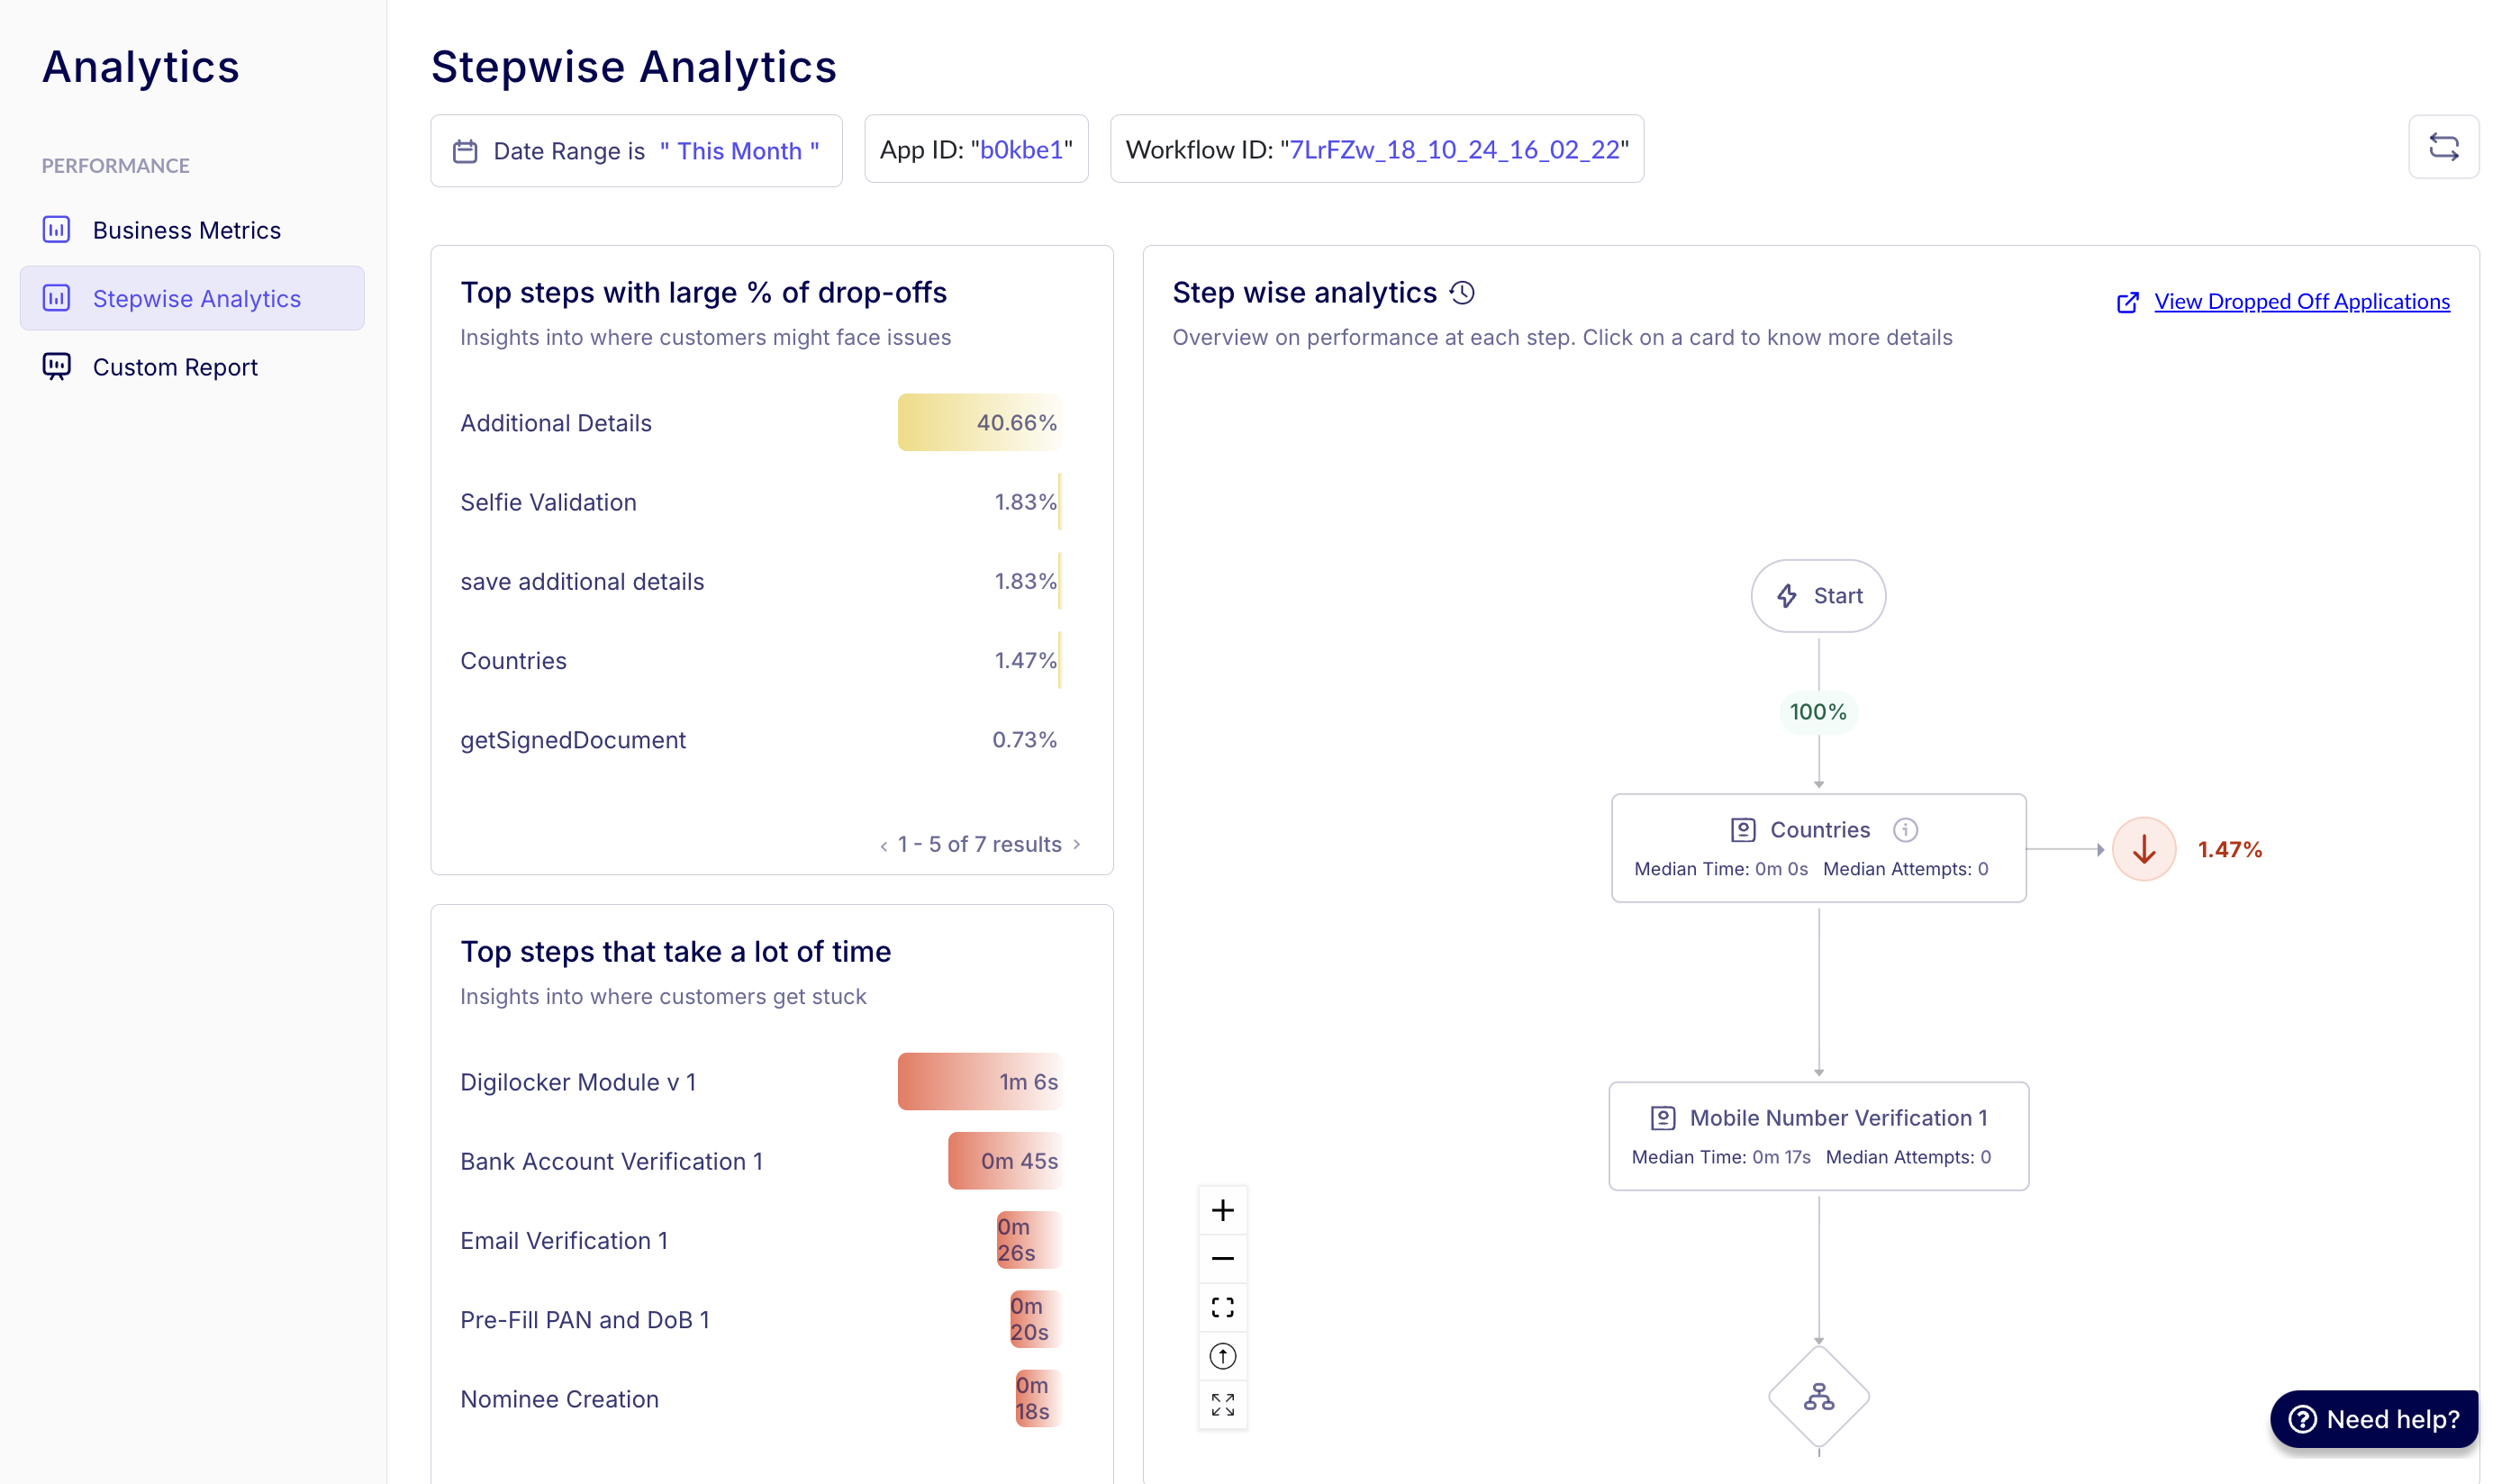
Stepwise Analytics enables granular analysis of user interactions at each workflow module, helping identify friction points in verification processes.
This tool provides operational teams with actionable data to optimize user journeys and reduce abandonment rates.
Purpose & use case
- Who is this for? Operations Team, Analytics Team.
- When should this be used?
- Diagnosing stage-specific drop-offs: Analyze user progression through each step to identify where users are dropping off. This helps in uncovering friction points — such as lengthy document uploads, authentication failures, or manual review delays — that impact completion rates.
- Validating workflow redesigns: Compare pre- and post-implementation data to measure the effectiveness of workflow changes. By tracking improvements in approval rates, reduced drop-offs, or faster processing times, teams can ensure that changes lead to a more seamless user experience.
Deep dive
1. Core concepts
Four key hotspot categories:
- % Drop-offs — Stages losing highest user percentage.
- Time Sinks — Modules with longest completion times.
- Retry Clusters — Steps requiring multiple attempts.
- Backtrack Points — Stages causing user confusion.
Filters available
- Date Range: Filter insights based on a specific timeframe, such as the last 14 days.
- App ID: App IDs are credentials provided to clients, e.g.,
"b0kbe1". Under each App Id, there can be multiple workflows. - Workflow ID: View data across all workflows or drill down into a specific workflow.
2. Technical details & workflows
Module metrics calculation:
# Drop-off Percentage Formula
(users_lost / total_users_started) * 100
Performance benchmarking:
| Metric | Calculation method | Why median? |
|---|---|---|
| Completion Time | 50th percentile value | Reduces outlier impact |
| Attempts | Middle value of sorted attempts | Avoids skew from power users |
Graph visualization:
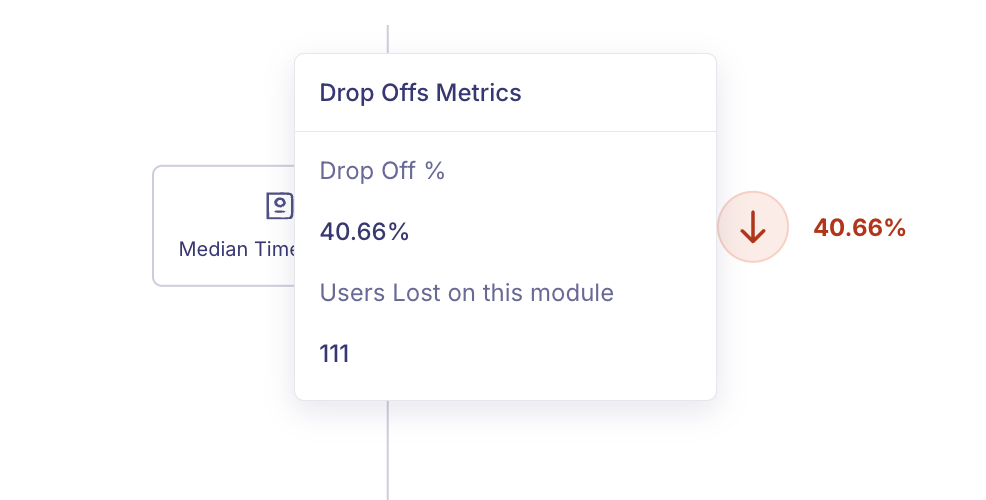
Hover actions:
- Drop Off %: Drop Off % represents the percentage of users who abandoned the process at a specific stage out of those who entered that stage.
- Users lost on this module: Users lost on this module indicates the number of users who did not proceed beyond a particular stage in the process and exited the funnel at that point.
Interpreting drop-off rates
- The drop-off rates are the total number of applications lost at each stage relative to the total number of applications at the start of the workflow.
- This stage-by-stage drop-off analysis helps pinpoint critical bottlenecks, enabling targeted improvements in workflow design.
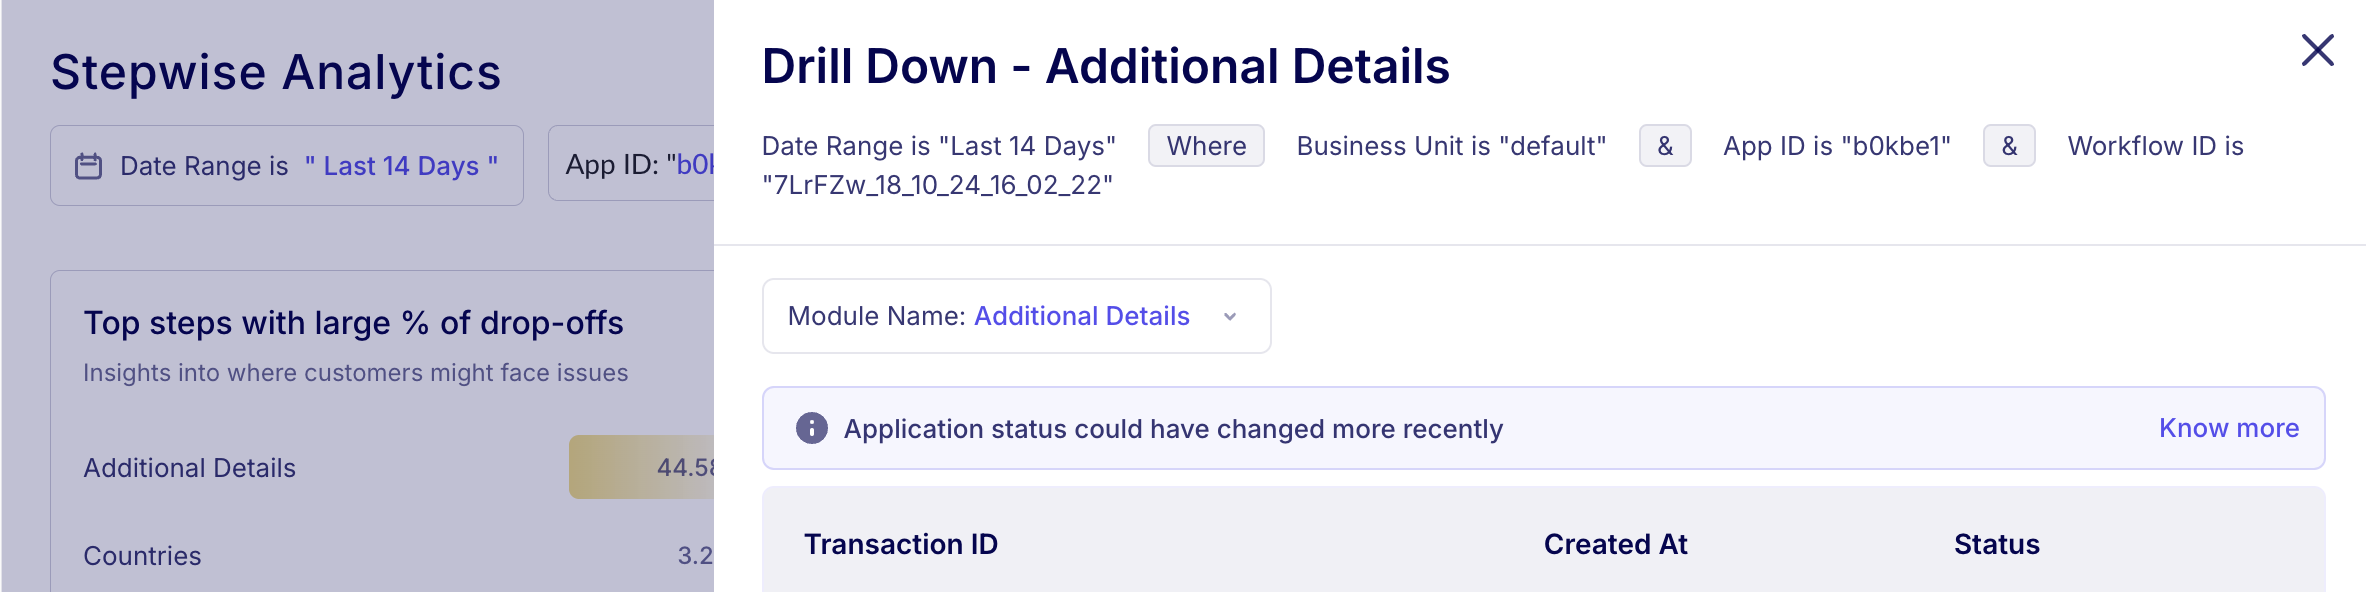
Drill down — additional details into individual sessions:
FAQs
Q: Why analyze back button clicks specifically? A: Reveals stages where users reconsider inputs — often indicates unclear instructions or excessive data demands.
Q: How fresh is the analytics data? A: Updated every 15 minutes with under 2 min processing latency.